[[TOC]]
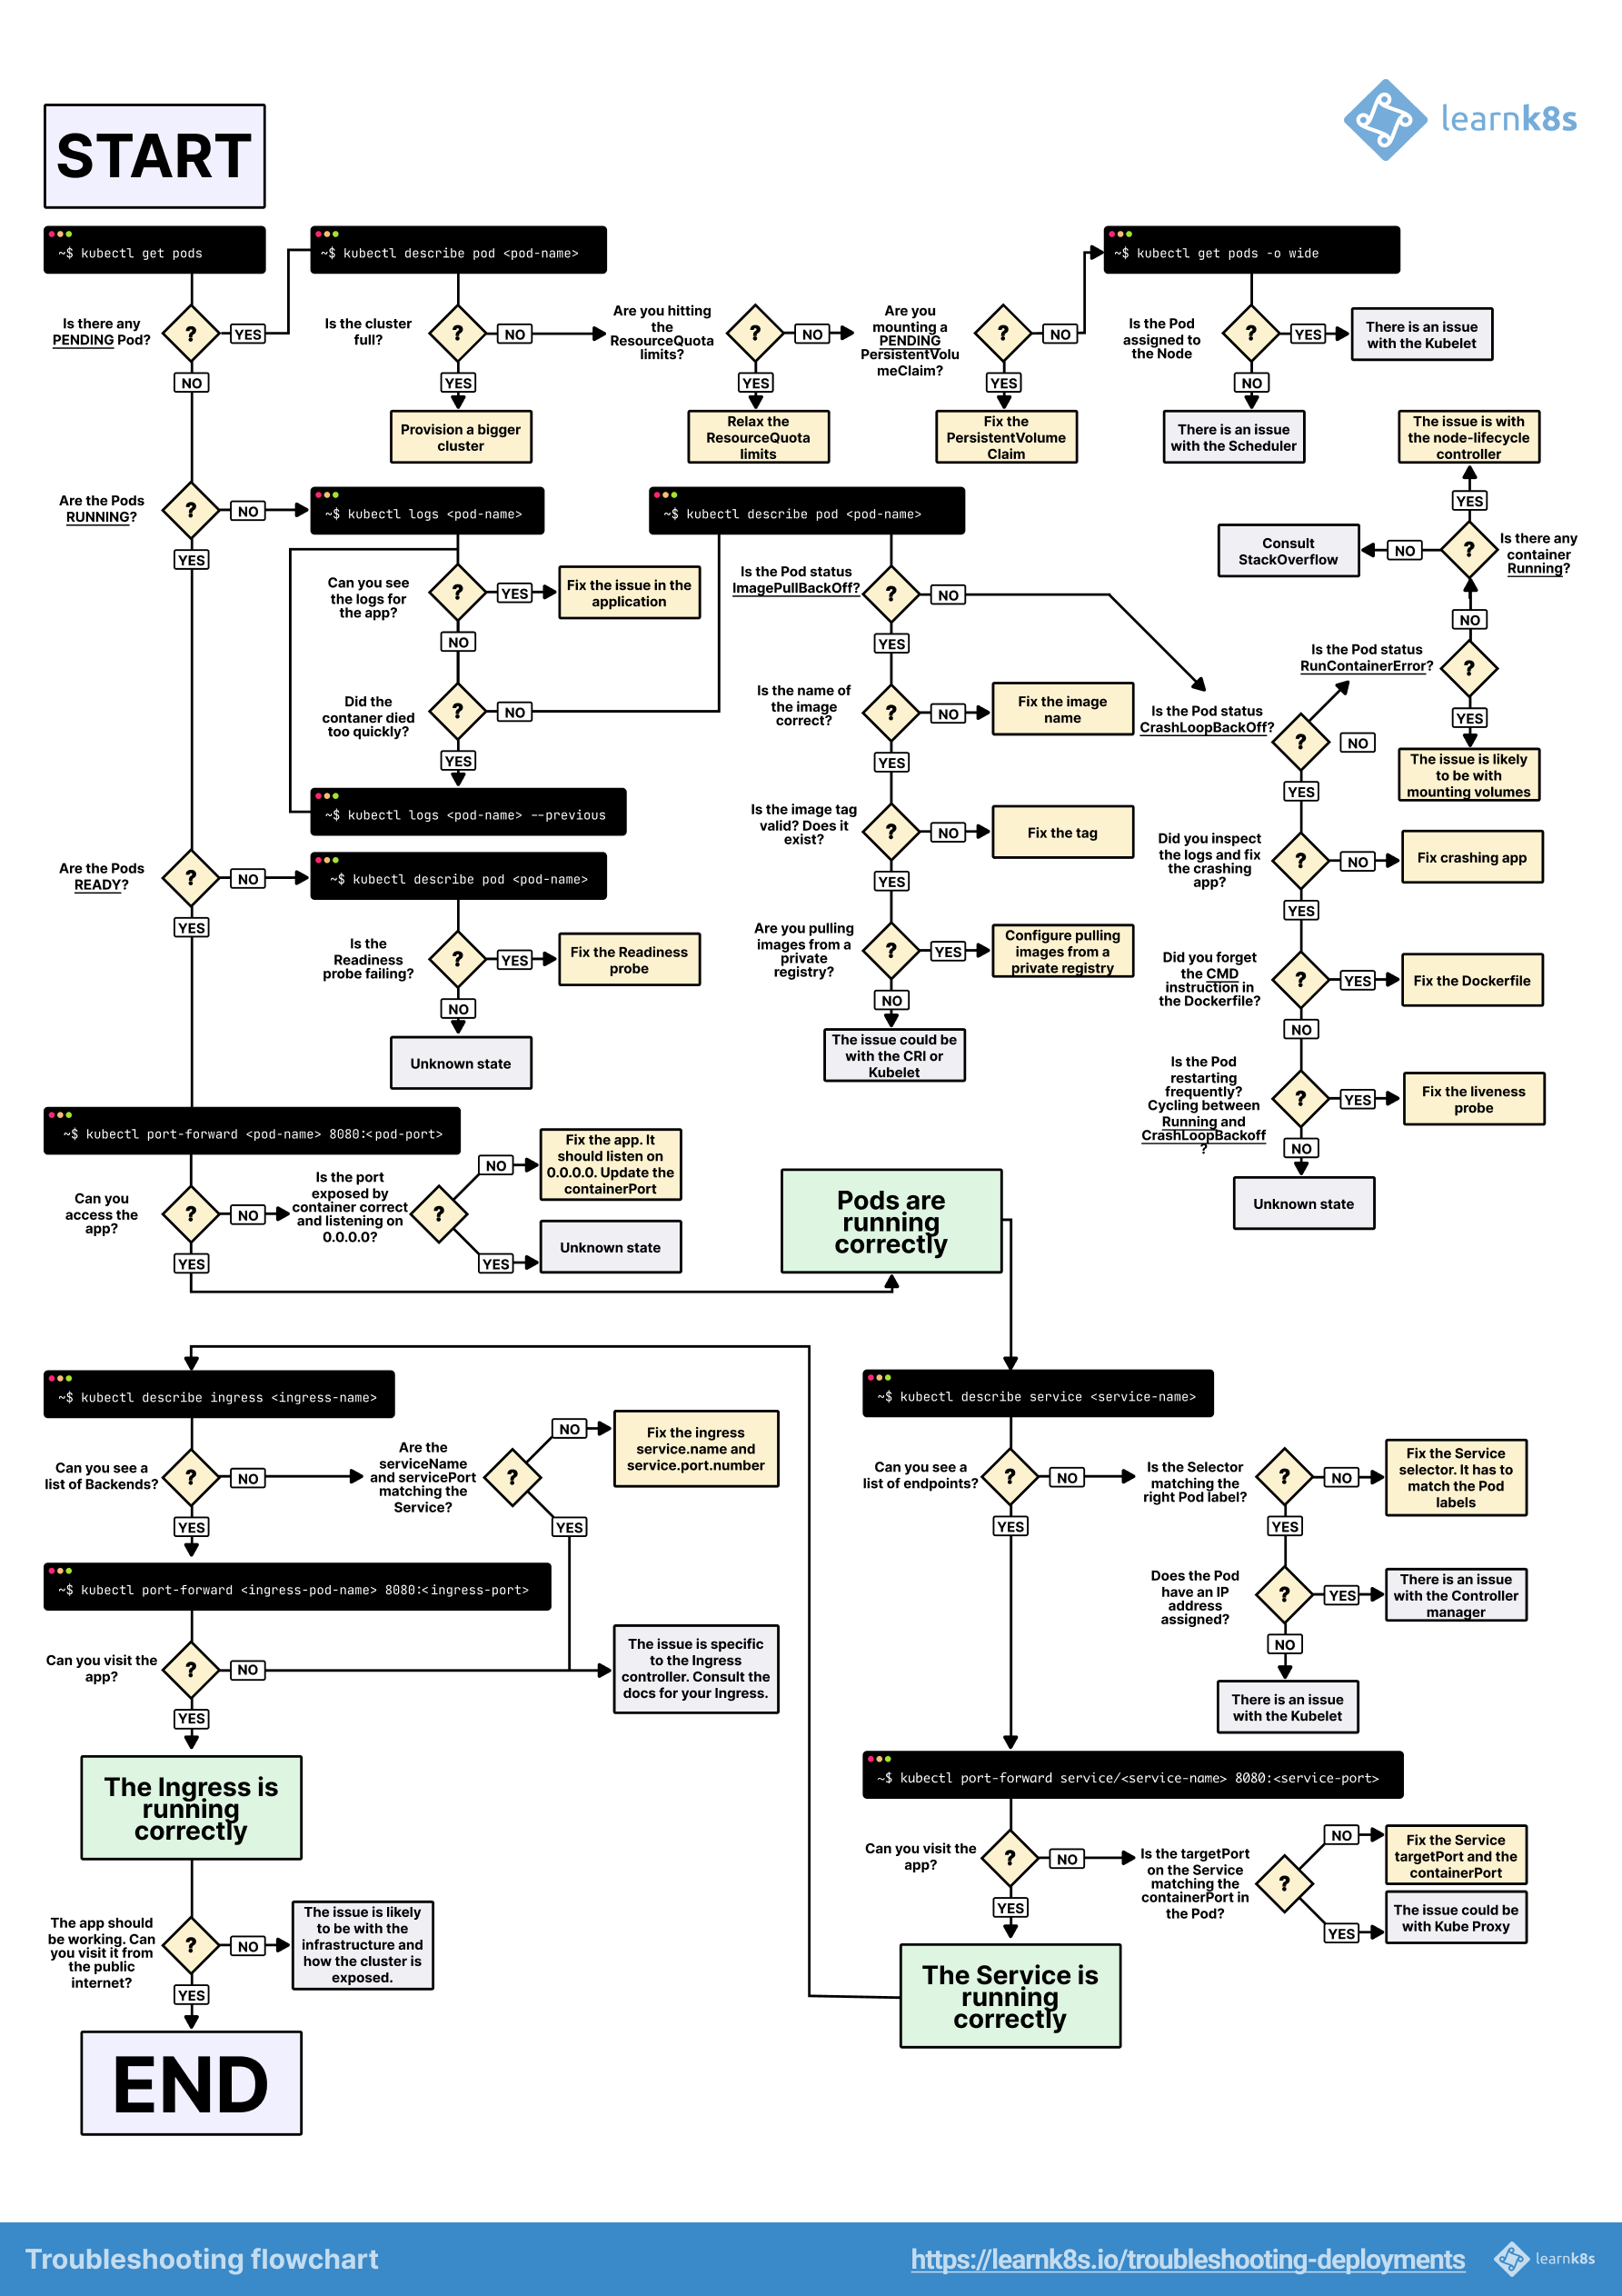
TL;DR - my app doesn't work - help!
Visual guideline using kubectl commands to investigate most common issues
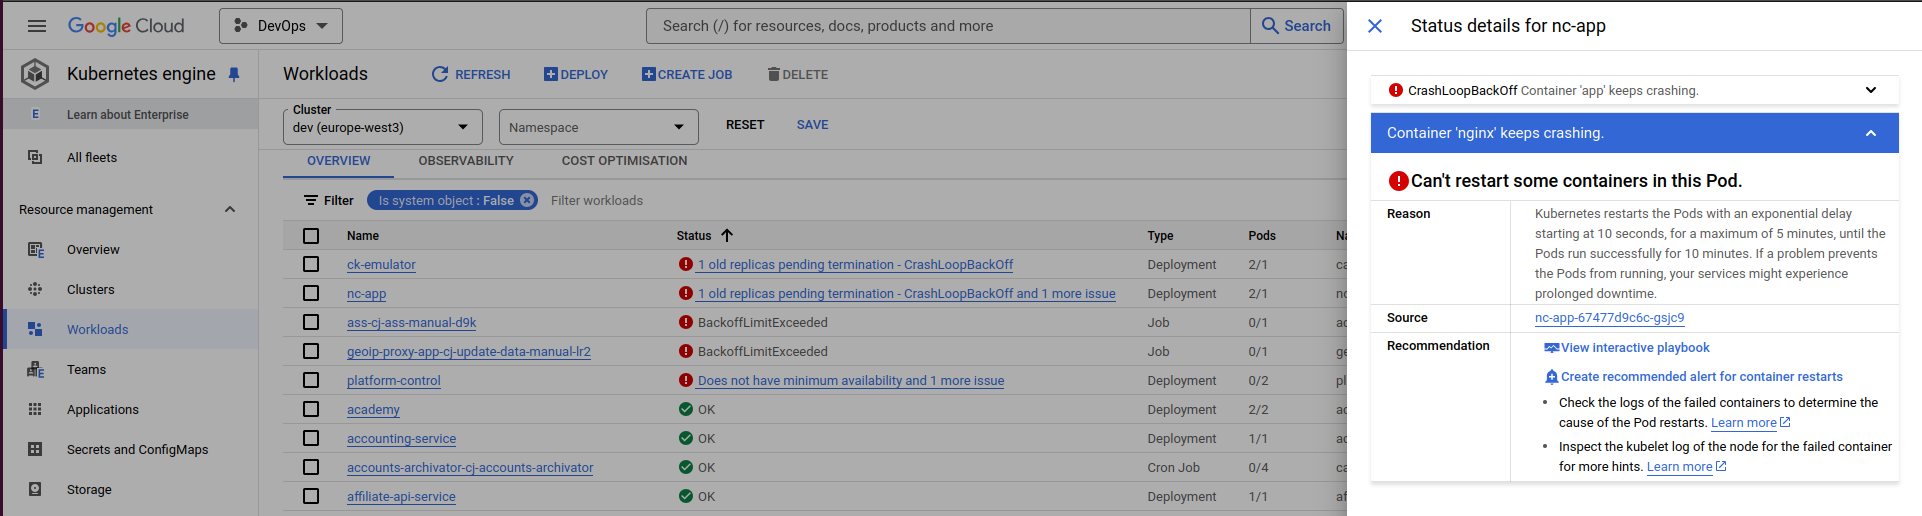
Using Google Cloud Console for troubleshooting
Google Cloud Console can also help you with troubleshooting.
Access workloads of cluster in DevOps project -> Kubernetes Engine -> Workloads - https://console.cloud.google.com/kubernetes/workload/overview?project=devops-309909

You can filter the view by environment (choose clusters: dev , stage, prod) and namespaces (choose your namespace).
Clicking on non-OK status of workload, Google offers some hints on what could be wrong and next steps (such as interactive playbook).
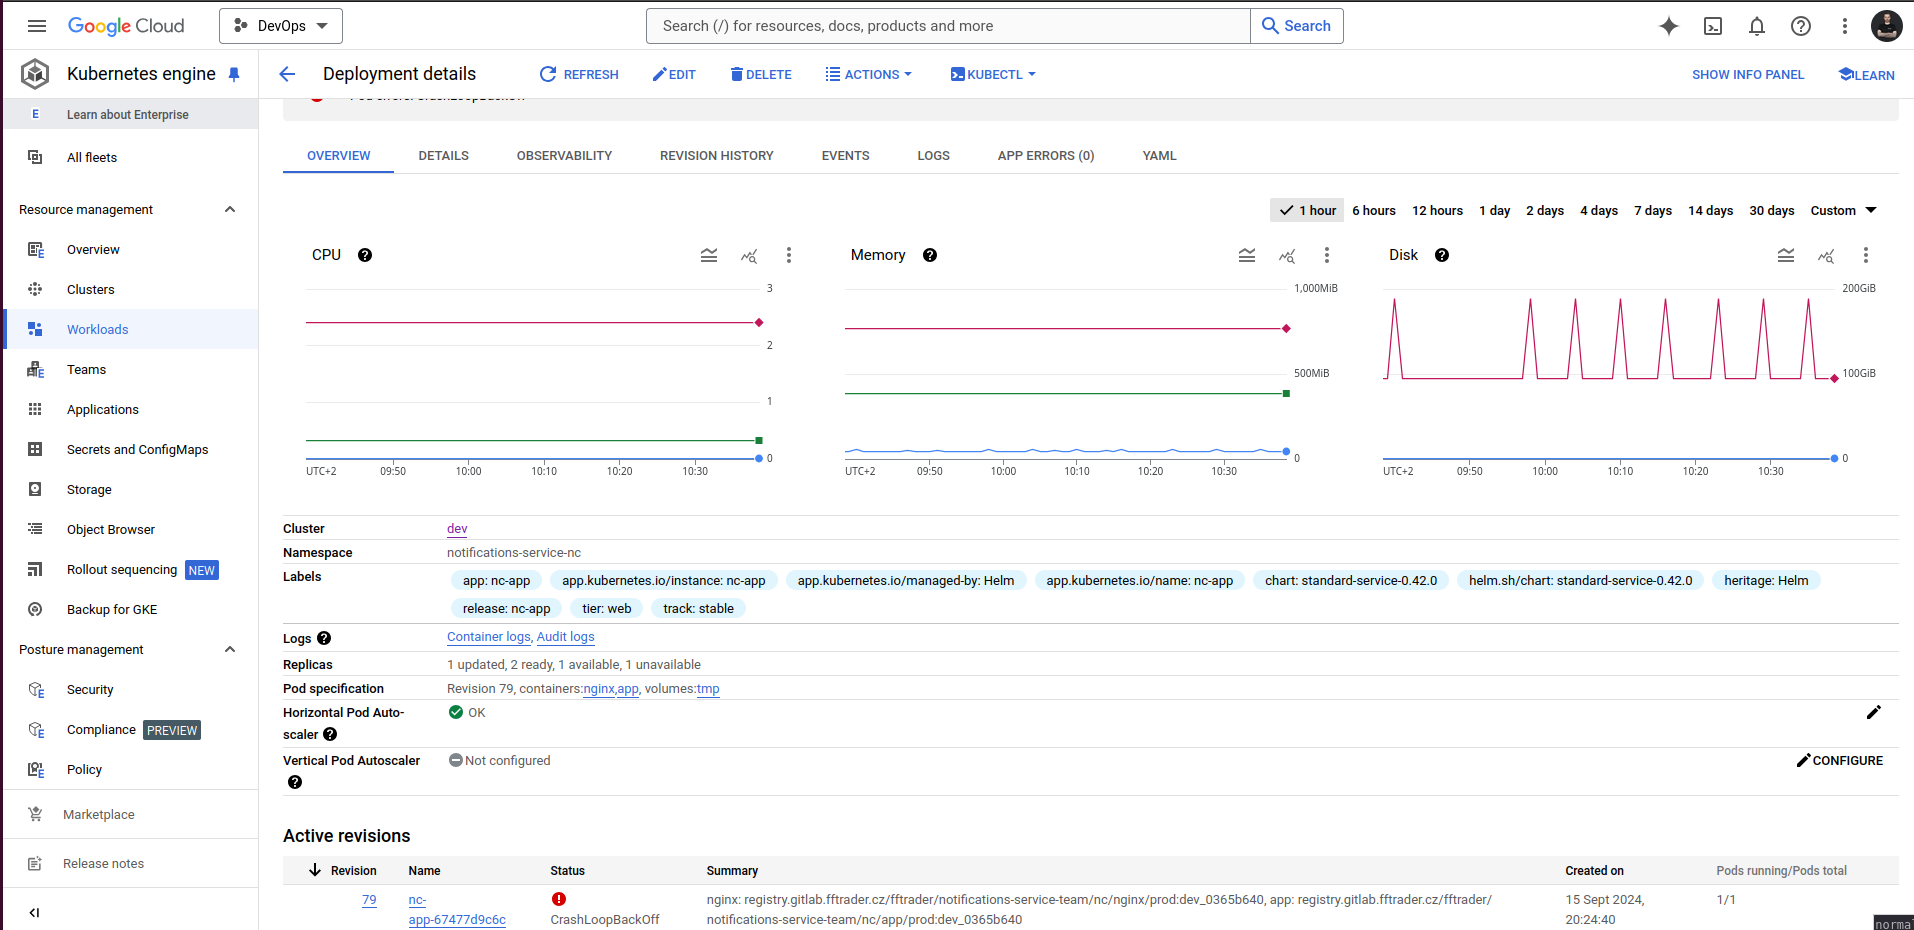
For observability, we recommend using Grafana and Elastic. Nevertheless, Google Cloud Console can provide you with basic information about the deployment.
Extra links for your troubleshooting reference: - https://kubernetes.io/docs/tasks/debug/debug-application/ - https://cloud.google.com/kubernetes-engine/docs/troubleshooting#workload_issues
Grafana Dashboards
We find these Grafana dashboards useful to get sense of what is happening with your application.
- CPU usage in namespace, number of pods and their phase - https://grafana.fftrader.cz/goto/ueOLmrgNR?orgId=1
- useful to get sense if my CPU / memory usage spiked
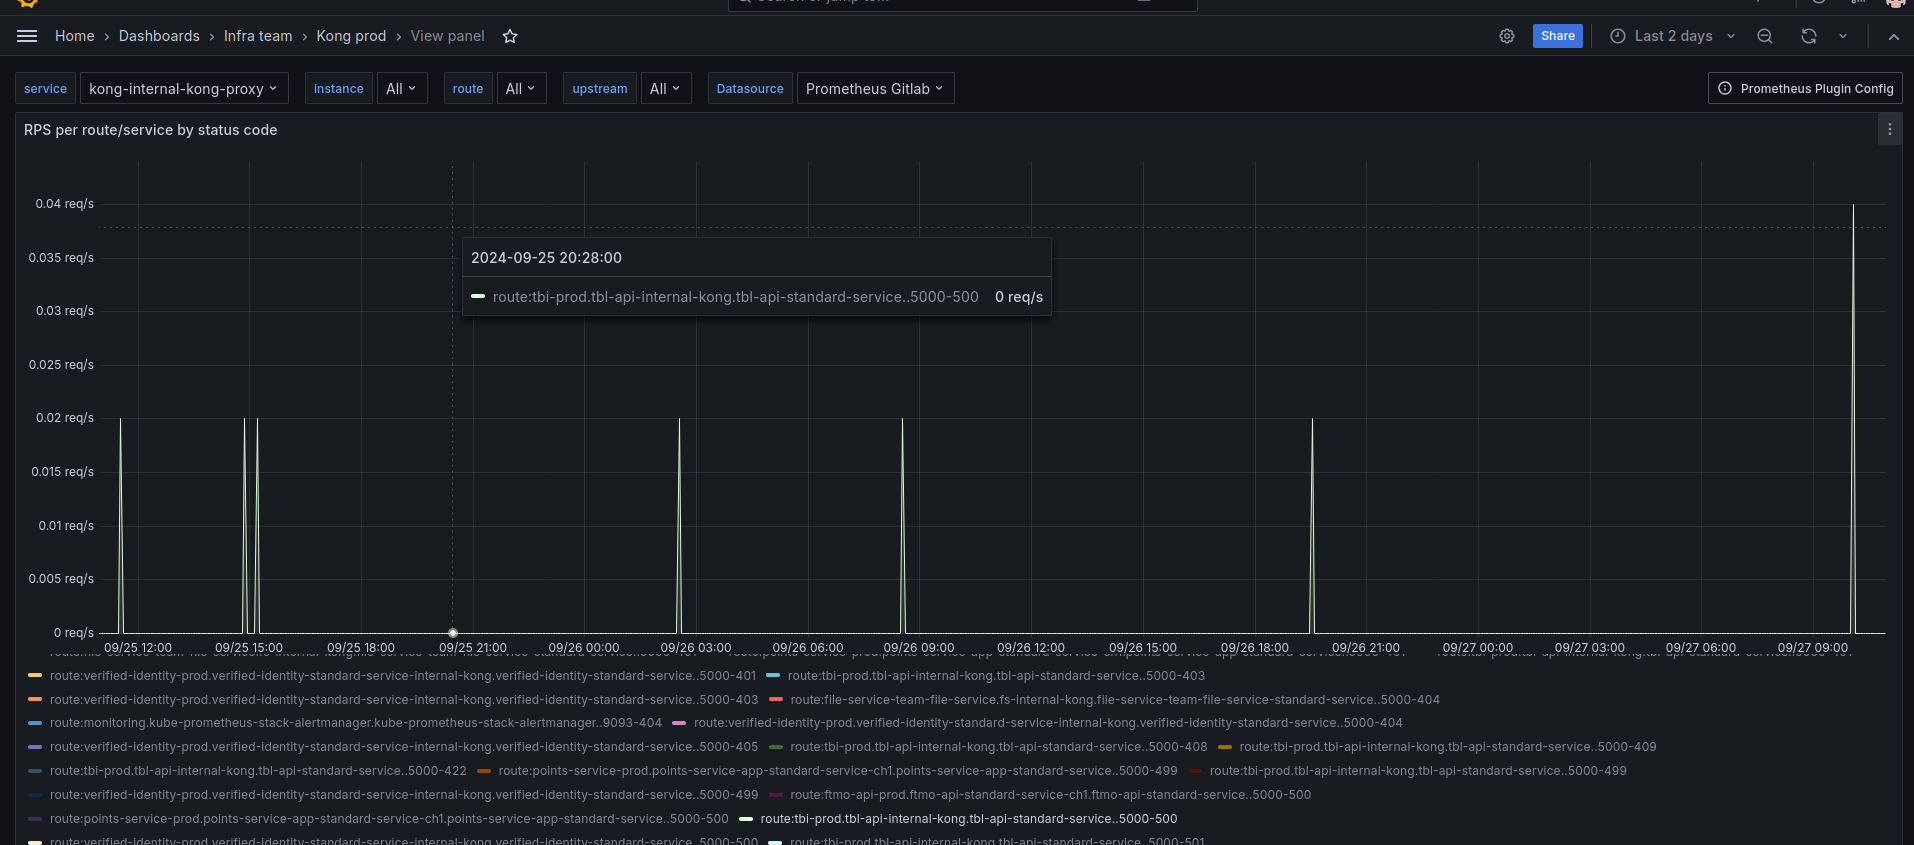
- Inspecting what happens on API GW (channel 1, channel 2, channel 3, channel 4) - Kong
<env>(for each env it's different link, search for Kong dev, Kong stage, ...) - https://grafana.fftrader.cz/goto/AzX6irRHg?orgId=1 - channel 1 =
kong-internal-kong-proxy - channel 2,3,4 =
kong-kong-proxy - useful to see 5xx errors, latency, etc.
For example, here are 500 on channel 1 for production tbl-api in last 2 days.
Don't be afraid to copy the panels / dashboards to your team's dashboard, if you find them valuable!