Installing php-fpm_exporter on legacy VM's
This guide will walk you through php-fpm-exporter installation process on a legacy VM.
Table of contents
[[TOC]]
Overview
php-fpm-exporter is a opensource Prometheus exporter written in Go, collecting php-fpm metrics. You can find it here: https://github.com/hipages/php-fpm_exporter.
The installation is automated, and you will need to use the script install_prometheus_exporters.sh from the Server Management repository.
Afterwards you will need to configure the VM's firewall and add the exporter as a data source into our Prometheus.
Installation steps
Pre-requisities
This step is easier to do manually than using the script.
Since we are going to monitor the PHP-FPM pools, we need to turn on /status page for the pools. This is by default turned off.
Check the pools you want to monitor in /etc/php/$PHP_VERSION/fpm/pool.d:
Each pool must have this stanza in the config:
If it is not there, add it there manually for every pool. Then restart PHP-FPM:
Installing the exporter
First, get the latest version of the Server Management repository. Either check it out, or pull latest changes:
Next run the install_prometheus_exporters.sh script. The script can also install a general node_exporter and iptables_exporter but we will disable their installation with a env variable:
# as root
cd server-management
chmod 700 scripts/install_prometheus_exporters.sh
NODE=0 IPTABLES=0 scripts/install_prometheus_exporters.sh
The script will refresh APT package lists and as you for the latest GO installation package:
Go to https://go.dev/dl/ and copy the link to the latest stable go version for AMD64. In this case it would be go1.21.0.linux-amd64.tar.gz. Paste the full link (https://go.dev/dl/go1.21.0.linux-amd64.tar.gz) into the script:
Please provide link to latest go version (from https://go.dev/dl/):https://go.dev/dl/go1.21.0.linux-amd64.tar.gz^@
--2023-08-17 10:33:40--  https://go.dev/dl/go1.21.0.linux-amd64.tar.gz
Resolving go.dev (go.dev)... 216.239.34.21, 216.239.32.21, 216.239.38.21, ...
Connecting to go.dev (go.dev)|216.239.34.21|:443... connected.
HTTP request sent, awaiting response... 302 Found
Location: https://dl.google.com/go/go1.21.0.linux-amd64.tar.gz [following]
--2023-08-17 10:33:40--  https://dl.google.com/go/go1.21.0.linux-amd64.tar.gz
Resolving dl.google.com (dl.google.com)... 216.58.212.174, 2a00:1450:4001:80f::200e
Connecting to dl.google.com (dl.google.com)|216.58.212.174|:443... connected.
HTTP request sent, awaiting response... 200 OK
Length: 66479500 (63M) [application/x-gzip]
Saving to: �latest_go.tar.gz�

latest_go.tar.gz                                     100%[=====================================================================================================================>]  63.40M   101MB/s    in 0.6s

2023-08-17 10:33:41 (101 MB/s) - �latest_go.tar.gz� saved [66479500/66479500]

Getting latest php-fpm-exporter
The script will proceed to install the php-fpm-exporter from the Github repository. It will also create a Linux service called php-fpm-exporter and add it to systemd. Afterwards it will ask you for the PHP-FPM pools you would like to collect data about:
Please provide a comma-separated list of all fpm pool's sockets.
The list must be in this form: "unix:/run/php/php8.2-fpm-nbo-general.sock;/status,NEXT_SOCKET;/status":
Every FPM pool has usually one unix socket (on legacy VMs) which is used for communication with Nginx but also for pulling metrics. The exporter uses this socket to pull data about the FPM pool statistics.
To find out the socket names you can do a quick grep in Nginx config files:
# cat /etc/nginx/sites-enabled/*|grep sock|awk {'print $2;'}|sort|uniq
unix:/var/run/php/8.2-api.sock;
unix:/var/run/php/8.2-bo.sock;
unix:/var/run/php/8.2-trader-dev-api.sock;
unix:/var/run/php/8.2-trader-dev-bo.sock;
unix:/var/run/php/8.2-trader-dev.sock;
unix:/var/run/php/8.2-trader-stage-api.sock;
unix:/var/run/php/8.2-trader-stage-bo.sock;
unix:/var/run/php/8.2-trader-stage.sock;
unix:/var/run/php/8.2-trader-test.sock;
unix:/var/run/php/8.2-trader.sock;
You can also check all the pool configs in PHP:
ls -la /etc/php/8.2/fpm/pool.d/
total 48
drwxr-xr-x 2 root root 4096 Aug  1 13:56 .
drwxr-xr-x 5 root root 4096 Aug  1 13:54 ..
-rw-r--r-- 1 root root  506 Jun 14 13:11 api.conf
-rw-r--r-- 1 root root  504 Jun 14 13:12 bo.conf
-rw-r--r-- 1 root root  521 Feb 16 12:34 trader-dev-api.conf
-rw-r--r-- 1 root root  518 Feb 16 12:34 trader-dev-bo.conf
-rw-r--r-- 1 root root  520 Feb 16 12:32 trader-dev.conf
-rw-r--r-- 1 root root  525 Jun 10 09:13 trader-stage-api.conf
-rw-r--r-- 1 root root  522 Jun 10 09:13 trader-stage-bo.conf
-rw-r--r-- 1 root root  522 Jun 10 09:13 trader-stage.conf
-rw-r--r-- 1 root root  522 Jun 14 13:19 trader-test.conf
-rw-r--r-- 1 root root  541 Jun 14 13:11 trader.conf
If you want to monitor all pools, you can use this one-liner to create the string for the installation script:
conf_string="";for sock in `cat /etc/nginx/sites-enabled/*|grep sock|awk {'print $2;'}|sort|uniq`; do conf_string="$conf_string,"$sock"/status"; done; echo ""; echo \"$conf_string\"|sed 's/\",/\"/g'
The output of the one-liner would be:
"unix:/var/run/php/8.2-api.sock;/status,unix:/var/run/php/8.2-bo.sock;/status,unix:/var/run/php/8.2-trader-dev-api.sock;/status,unix:/var/run/php/8.2-trader-dev-bo.sock;/status,unix:/var/run/php/8.2-trader-dev.sock;/status,unix:/var/run/php/8.2-trader-stage-api.sock;/status,unix:/var/run/php/8.2-trader-stage-bo.sock;/status,unix:/var/run/php/8.2-trader-stage.sock;/status,unix:/var/run/php/8.2-trader-test.sock;/status,unix:/var/run/php/8.2-trader.sock;/status"
Paste this string into the installation script and finish the installation. The script will show running exporter's sockets at the end:
tcp        0      0 0.0.0.0:10100           0.0.0.0:*               LISTEN      536/python
tcp        0      0 10.156.0.2:10100        34.141.21.167:50402     TIME_WAIT   -
tcp6       0      0 :::10101                :::*                    LISTEN      575/prometheus-node
tcp6       0      0 10.156.0.2:10101        34.141.21.167:60764     ESTABLISHED 575/prometheus-node
tcp6       0      0 :::10102                :::*                    LISTEN      3442893/php-fpm_exp
As you can see, php-fpm_exporer is listening on port 10102.
Check if installation was correct:
systemctl status php-fpm-exporter
cat /etc/systemd/system/php-fpm-exporter.service
curl localhost:10102/metrics
See debugging for some cool tricks how to spot and solve problems :D
Opening the firewall
The exporter is listening on port 10102. We need to open this port so that Prometheus can connect and collect metrics:
Find this line in the firewall config:
# Allow incoming Prometheus query from grafana-internal (34.141.21.167)
$IPT -A INPUT -i $EXT_IF -p tcp -s 34.141.21.167 --destination-port 10100:10101 -m state --state NEW -j ACCEPT -m comment --comment "iptables-exporter prometheus in"
Change it like this (extend the port range to include 10102):
# Allow incoming Prometheus query from grafana-internal (34.141.21.167)
$IPT -A INPUT -i $EXT_IF -p tcp -s 34.141.21.167 --destination-port 10100:10102 -m state --state NEW -j ACCEPT -m comment --comment "iptables-exporter prometheus in"
Also change the tagging rules for output traffic:
$IPT -A OUTPUT -o $EXT_IF -p tcp --sport 10100:10102 -j ACCEPT -m comment --comment "iptables-exporter prometheus out"
Reload the firewall:
Et voila!
Adding the source to Prometheus
Last step is adding the new source to the Prometheus on the grafana-internal (34.141.21.167)VM:
Add the new source to the Prometheus config, extending the existing source definitions for the VM. In this case it would be Trader. This is the existing config:
# cat /etc/prometheus/prometheus.yml

- job_name: 'iptables_trader.ftmo.com'
  static_configs:
    - targets: ['35.246.244.35:10100']

- job_name: trader.ftmo.com
  static_configs:
    - targets: ['35.246.244.35:10101']
Add a new job in a form simillar to the existing iptables_trader.ftmo.com job. Modify it so that you replace the port to 10102 and iptables to fpm:
Together the jobs for Trader should look like this:
- job_name: 'iptables_trader.ftmo.com'
static_configs:
- targets: ['35.246.244.35:10100']
- job_name: trader.ftmo.com
static_configs:
- targets: ['35.246.244.35:10101']
- job_name: 'fpm_trader.ftmo.com'
  static_configs:
    - targets: ['35.246.244.35:10102']
Restart Prometheus:
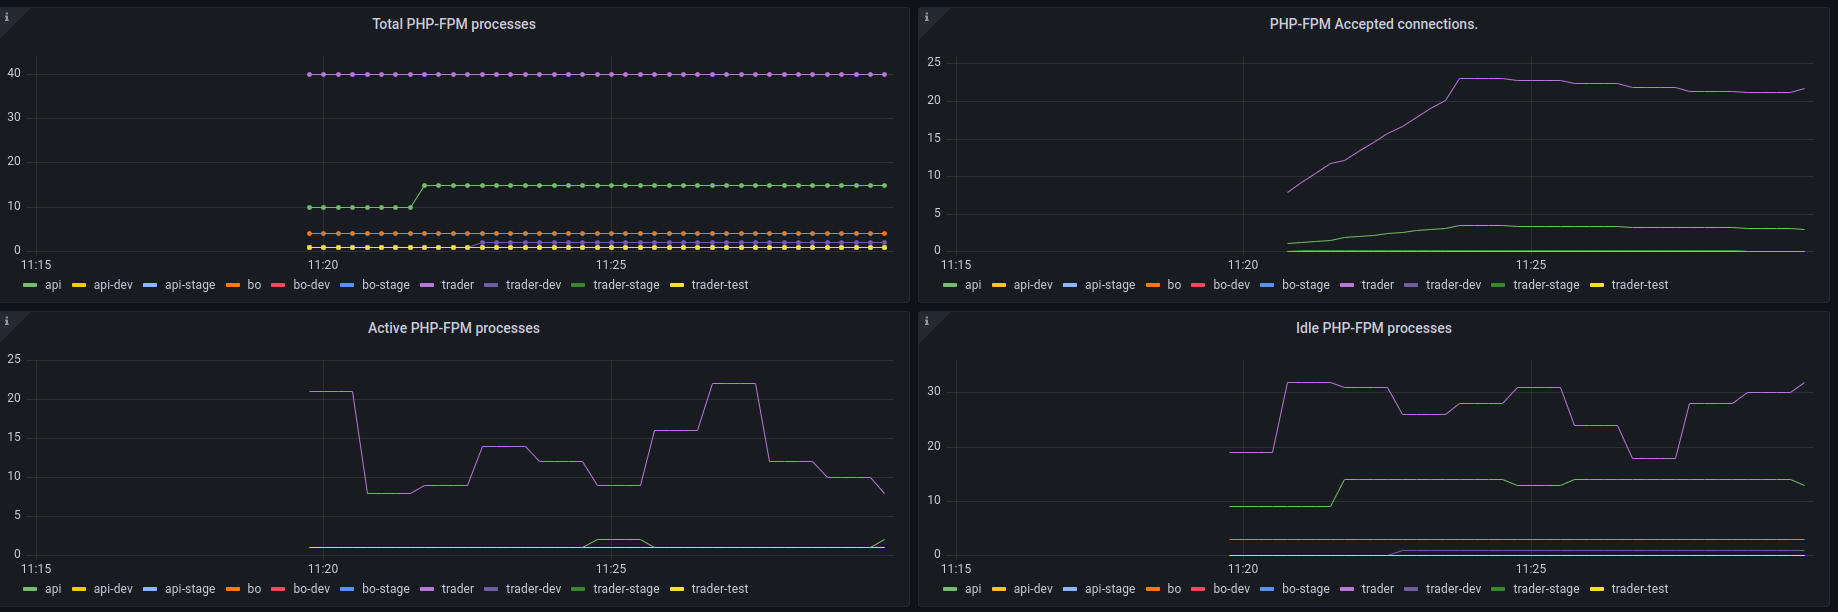
Wait a few minutes and check if you can see data in the PHP Statistics section of the FTMO Servers dashboard:
https://grafana.srv.fftrader.cz/goto/pxyeGGgIz?orgId=1
Dont forget to select the correct VM in the Job dropdown on the top of the dashboard. Also select a lower time period (15m) to be able to see new data.
Debugging
If you see anything like this while checking if the exporter works (eg. that the sockets couldnt be reached), something is wrong.
#systemctl status php-fpm-exporter

...

Aug 17 10:50:51 ftmo-web-trader php-fpm_exporter[3447437]: time="2023-08-17T10:50:51+02:00" level=error msg="Error scraping PHP-FPM: invalid character 'F' looking for beginning of value"
Aug 17 10:50:51 ftmo-web-trader php-fpm_exporter[3447437]: time="2023-08-17T10:50:51+02:00" level=error msg="Error scraping PHP-FPM: invalid character 'F' looking for beginning of value"

# curl localhost:10102/metrics

...

# TYPE phpfpm_scrape_failures counter
phpfpm_scrape_failures{pool="",scrape_uri="unix:/var/run/php/8.2-api.sock;/status"} 3
phpfpm_scrape_failures{pool="",scrape_uri="unix:/var/run/php/8.2-bo.sock;/status"} 3

...
Best way to debug this is to use exporter in get mode:
# mind the double quotes, your shell migh interpret ";" as next command

/root/go/bin/php-fpm_exporter get --phpfpm.scrape-uri "unix:/var/run/php/8.2-api.sock;/status"
If this doesnt work, check if the file exists and most importantly if the FPM pool has /status enabled.